Advanced Visualization | Data Visualization, Scientific Data Analysis

youtube.com

Explore advanced techniques for approximating and interpolating complex data sets, including ray casting based on higher-degree polynomial and piecewise trilinear/tricubic approximation.

University CoursesComputer GraphicsData Visualization

Introduction

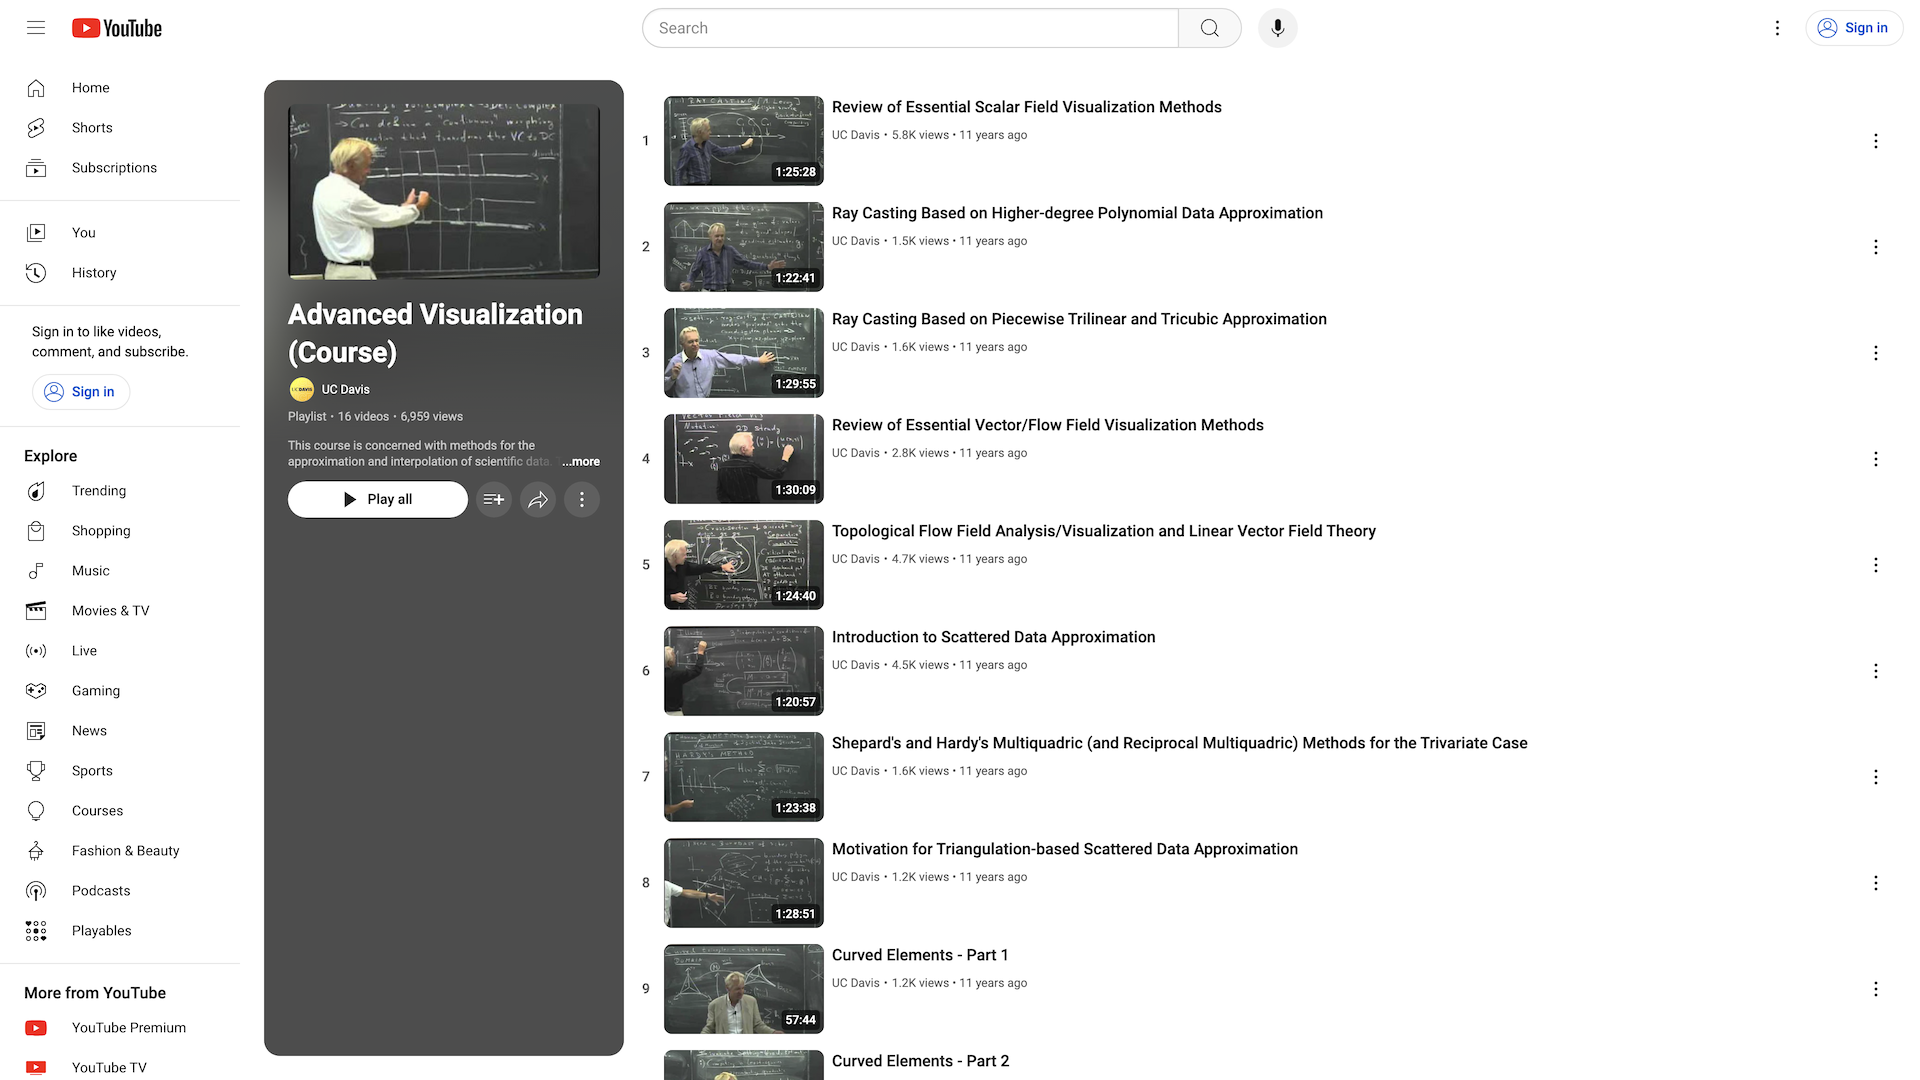
This course is concerned with methods for the approximation and interpolation of scientific data. The presented methods are of relevance especially for visualization-based data exploration and analysis.

screenshot

Highlights

  • Review of essential scalar field visualization methods
  • Ray casting based on higher-degree polynomial data approximation
  • Ray casting based on piecewise trilinear and tricubic approximation

Recommendation

This course is recommended for those interested in data visualization, scientific data analysis, and advanced techniques for approximating and interpolating complex data sets.

YouTube Videos

How GetVM Works

Learn by Doing from Your Browser Sidebar

Access from Browser Sidebar

Access from Browser Sidebar

Simply install the browser extension and click to launch GetVM directly from your sidebar.

Select Your Playground

Select Your Playground

Choose your OS, IDE, or app from our playground library and launch it instantly.

Learn and Practice Side-by-Side

Learn and Practice Side-by-Side

Practice within the VM while following tutorials or videos side-by-side. Save your work with Pro for easy continuity.

Explore Similar Hands-on Tutorials

Fundamentals of Data Visualization

4
Technical TutorialsData AnalysisData ScienceData Visualization
Comprehensive guide to understanding the principles and techniques of data visualization, covering design, perception, and communication of visual data. Practical insights and tools for creating effective visualizations.

Introduction to Modern OpenGL

18
Technical TutorialsC++Computer GraphicsOpenGL
Learn the latest OpenGL features and create modern graphics applications with interactive examples and expert guidance.

Learning Modern 3D Graphics Programming

26
Technical TutorialsComputer GraphicsOpenGL
Comprehensive guide to modern 3D graphics programming, covering the latest techniques and technologies. Suitable for beginners and experienced developers.

Extracting Data from NoSQL Databases: A Step towards Interactive Visual Analysis of NoSQL Data

23
Technical TutorialsData VisualizationNoSQL
Learn how to enable support for NoSQL databases in Spotfire, a software platform for data analysis and visualization. Explore solutions for extracting and importing non-relational data into Spotfire's tabular data model.

Build your own 3D renderer

7
Technical TutorialsComputer GraphicsJavaJavaScript
Comprehensive guide to building your own 3D renderer for computer graphics enthusiasts. Learn fundamentals, implement from scratch, and experiment with projects.

Computer Graphics from scratch

23
Technical TutorialsComputer GraphicsJavaScript
Comprehensive guide to understanding computer graphics fundamentals, including 3D rendering and mathematical principles. Build fully functional renderers without relying on existing APIs.

3D Modeling | Computer Graphics | Software Development

24
Technical TutorialsComputer GraphicsOpenGL
Explore the world of 3D modeling, computer graphics, and software development with this comprehensive course. Learn techniques, tools, and best practices for creating 3D models.

Data Science | Harvard University CS109 Course

12
University CoursesData VisualizationMachine LearningPython
Comprehensive introduction to data science, covering data wrangling, analysis, and machine learning. Prepares students for real-world data science challenges.

OpenCV Tutorials

0
Technical TutorialsComputer GraphicsComputer VisionOpenCV
Learn image processing, video analysis, and more with hands-on OpenCV tutorials. Suitable for beginners and experienced developers.